Figure 2.
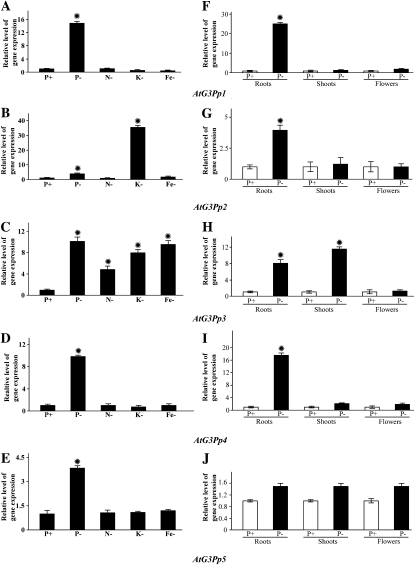
Relative expression analyses of G3Pps during Pi and other nutrient deficiencies. Real-time PCR analyses are shown for whole seedlings grown under full nutrient solution (P+) and those subjected to different nutrient deficiencies (Pi, N, K, and Fe) for 7 d (A–E) and different tissues (roots, shoots, and flowers) of hydroponically grown 4-week-old wild-type seedlings that were subjected to P+ (250 μm Pi) and P− (0 μm Pi) treatments for 7 d (F–J). AtACT2 was used as an internal control, and P+ values were normalized to 1. Data presented are means of six technical replicates ± se. An asterisk indicates a significant (>2.0-fold) increase in the relative level of gene expression compared with P+.

