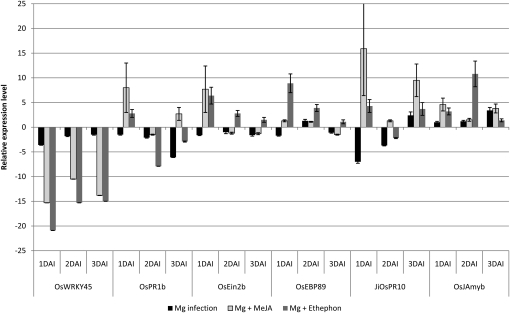
Figure 6.
qRT-PCR data on some selected defense-related genes in RKN galls on rice, and the effects of JA/ET-induced systemic defense on these genes. Bars represent mean expression levels and se from two biological and three technical replicates each containing a pool of eight plants. Data are shown as relative expression levels of infected and treated/untreated tissue in comparison with the control tissue (root tips of uninfected and untreated plants). Gene expression levels were normalized using two internal reference genes, OseIF4α and OsUBQ5.

