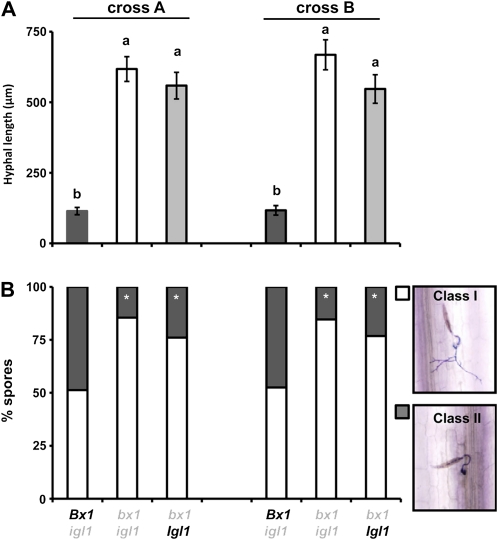
Figure 3.
Contribution of Bx1 and Igl to penetration resistance against the necrotrophic fungus S. turcica. Leaves of igl mutant lines, bx1 mutant lines, and bx1 igl double mutant lines were inoculated with 5 × 10⁴ spores mL−1 and 3 d later collected for lactophenol trypan blue staining and microscopy analysis. A, Average hyphal lengths (μm) emerging from fungal spores (±sem) in the epidermal cell layer. Different letters indicate statistically significant differences (ANOVA, followed by Fisher’s lsd test; α = 0.05; n = 16). B, Frequency distributions between developing germination hyphae (class I; white) and arrested germination hyphae (class II; gray). Asterisks indicate statistically significant differences compared to BX-producing igl mutant lines from each cross (χ2 test; α = 0.05; n = 16). The comparison between igl and bx1 igl mutant lines was repeated in two additional experiments with similar results.

