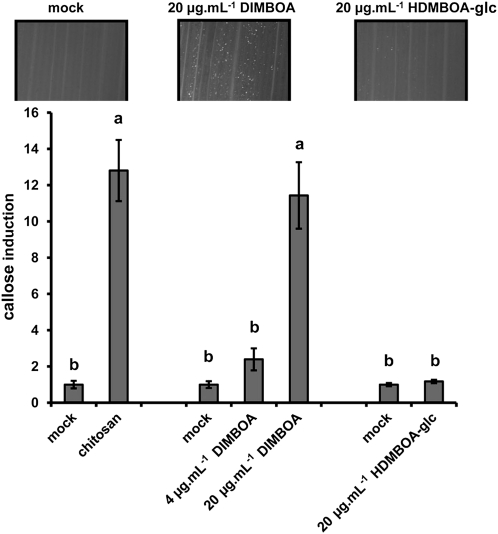
Figure 8.
DIMBOA-induced callose deposition. Infiltration with 20 μg mL−1 DIMBOA elicits similar levels of callose deposition as infiltration with chitosan (0.1%), whereas infiltration with 20 μg mL−1 HDMBOA-glc had no effect in comparison to the corresponding mock treatment. Shown are fold-induction values of callose deposition (±sem; n = 15), relative to average callose intensities in mock treatments at 24 h after infiltration treatment. Different letters indicate statistically significant differences (ANOVA, followed by Fisher’s lsd test; α = 0.05). Photographs show representative differences in fluorescent callose signals by UV-epifluorescence microscopy.

