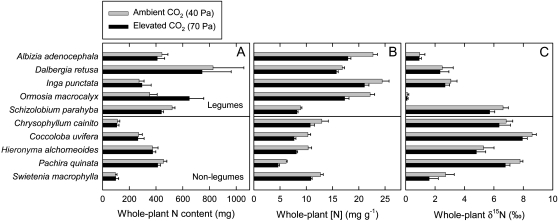
Figure 4.
Final plant N mass (A), final plant [N] (B), and final plant δ15N (C) of seedlings of 10 tropical tree species grown at either ambient (40 Pa) or elevated (70 Pa) CO2 partial pressure. Plants were grown in unfertilized soil at high water supply. The top five species are legumes and the bottom five species are nonlegumes. Each bar represents the average of five or six plants. Error bars represent se.

