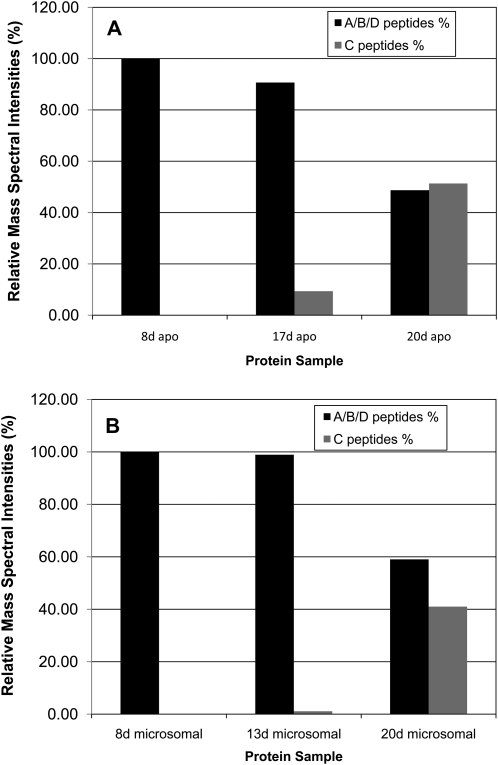
Figure 6.
Relative abundance of Sus protein isoforms quantified by relative mass spectral intensities of diagnostic peptides for SusC and the combined A, B, and D isoforms. A, Relative spectral intensities for the apoplast protein pool of fiber at 8, 17, and 20 DAF. B, These same data for the microsomal protein pool at 8, 13, and 20 DAF.

