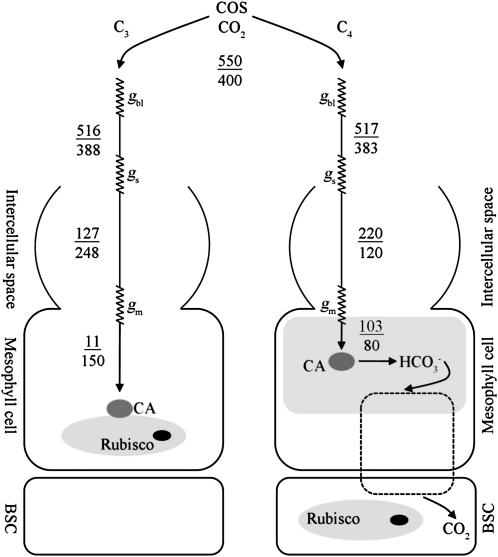
Figure 1.
Comparison of the diffusion pathways of COS and CO2 from the atmosphere to the site of biochemical reactions in C3 and C4 leaves. Concentrations of COS (pmol mol−1) and CO2 (μmol mol−1) are indicated above and below the lines, respectively. Conductance through resistance steps associated with the boundary layer, stomata, and mesophyll (mol m−2 s−1) are indicated by gbl, gs, and gm, respectively, based on leaves with net CO2 flux of 14 or 20 μmol m−2 s−1 (C3 and C4, respectively), and COS uptake flux of approximately 35 pmol m−2 s−1 (for both plant types). Values of gm (0.3 mol m−2 s−1 for both C4 and C3 leaves, respectively) were estimated by Stimler et al. (2010a) and incorporate dissolution, liquid-phase diffusion, and the biochemical step (assuming first-order reaction); gm estimates for CO2 were based on CO2 concentration at the hydration site derived from isotopic measurements (Gillon and Yakir, 2001).

