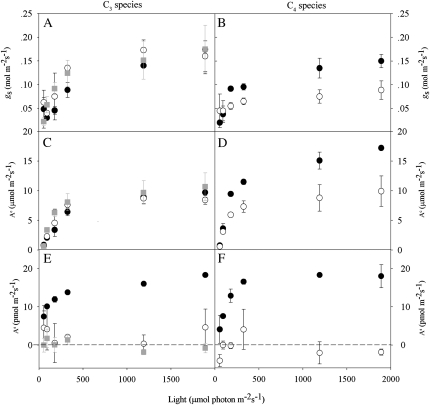
Figure 3.
Stomatal conductance (gs; mol m−2 s−1; A and B), CO2 uptake (Ac; μmol m−2 s−1; C and D), and COS uptake (As; pmol m−2 s−1; E and F) in tobacco (C3) and F. bidentis (C4) wild-type and antisense lines with different levels of CA activity during the light response experiments. Conditions during the experiments were as in Figure 2. Symbols (black circles, white circles, and gray squares) indicate wild type, moderate (10%, C3 and C4 plants), and low (2%, C3 only) CA activities of the antisense lines, respectively.

