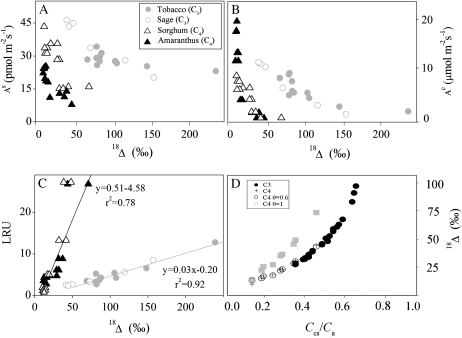
Figure 4.
Relationships between C18OO (18Δ; ‰) and rates of COS uptake (pmol m−2 s−1; A), CO2 uptake (μmol m−2 s−1; B), and LRU (C), observed in C3 (circles) and C4 (triangles) plants. Each curve represents the full set of data from a complete light response experiment. In C, r2 values for the linear best-fit lines for C4 and C3 plants are indicated (P < 0.0001). D, The relationship between 18Δ and CO2 concentrations at the hydration site (Ccs) from different light response experiments and plants. Conditions during gas exchange measurements were as in Figure 2. Black circles and crosses represent observed discrimination values; white symbols represent predicted values based on the indicated parameters and as described in Table II, following Gillon and Yakir (2001).

