Figure 6.
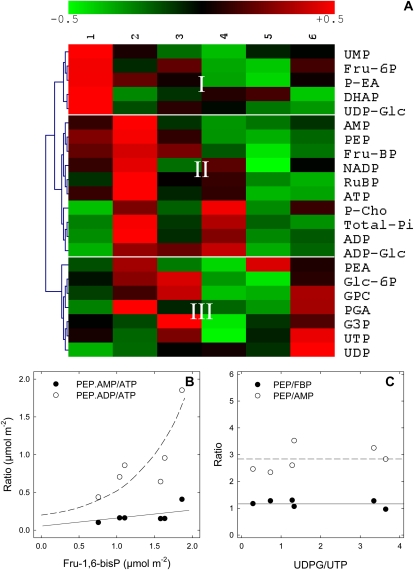
Natural variations in phosphometabolite content in illuminated cocklebur leaves, under 400 μmol mol−1 CO2, 21% O2, 23.5°C, 300 μmol mol−1 PAR, fed with pyruvate through the transpiration stream. A, Array representation of the phosphometabolome. Metabolites were quantified by liquid chromatography/time-of-flight mass spectrometry (ATP, ADP, AMP, UDP-Glc, ADP-Glc, UTP, UDP) and 31P-NMR (others). The hierarchical clustering (left) was carried out with the cosine correlation on mean-centered metabolite contents. The range of the natural variation of phosphometabolites is ±50% (color scale on top). Column numbers on top (1–6) are biological replicates. DHAP, Dihydroxyacetone phosphate; G3P, glyceraldehyde-3-phosphate; GPC, glyceryl-phosphophorylcholine; P-Cho, phosphoryl-choline; PEA, phosphatidyl-ethanolamine; P-EA, 3-phosphoryl-ethanolamine; PGA, phosphoglycerate; RuBP, ribulose-1,5-bisphosphate. B, Mass action ratio of phosphometabolites on the pyruvate kinase (PEP.ADP/ATP, white symbols) and PPDK (PEP.AMP/ATP, black symbols) as a function of Fru-1,6-bisphosphate. C, PEP content relative to Fru-1,6-bisphosphate (black symbols) or AMP (white symbols) as a function of UDP-Glc-UTP ratio, an indicator of Suc synthesis. In both B and C, metabolite concentrations are given in μmol m−2. Continuous and dashed lines represent the apparent trends of the curves.

