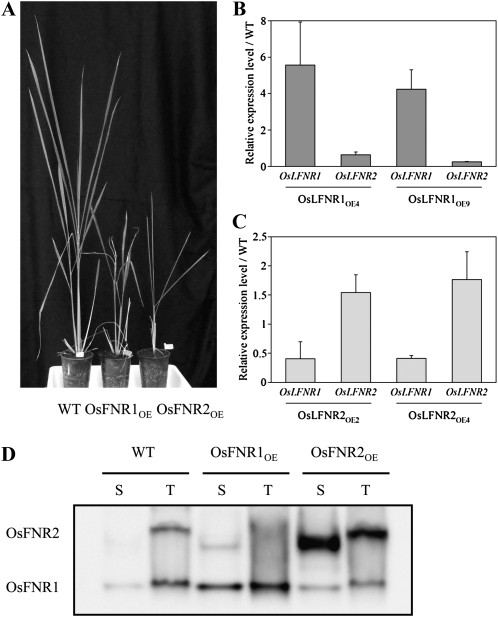
Figure 3.
Characterization of rice overexpression plants of OsLFNR1 and OsLFNR2. A, Growth of wild-type (WT) and T1 plants overexpressing OsLFNR1 and OsLFNR2. B, Relative expression levels of LFNR genes in rice plants overexpressing OsLFNR1. Two independent overexpression plants were analyzed by quantitative RT-PCR. C, Relative expression levels of LFNR genes in rice plants overexpressing OsLFNR2. Two independent overexpression plants were analyzed by quantitative RT-PCR. Expression levels of the LFNR genes were normalized with ubiquitin gene expression. Expression levels of each mutant line relative to those of the wild type are shown. Real-time PCR experiments were carried out at least four times. D, Protein levels of OsLFNR1 and OsLFNR2 in soluble (S) and thylakoid (T) fractions. A total of 10 μg of protein was loaded in each lane.

