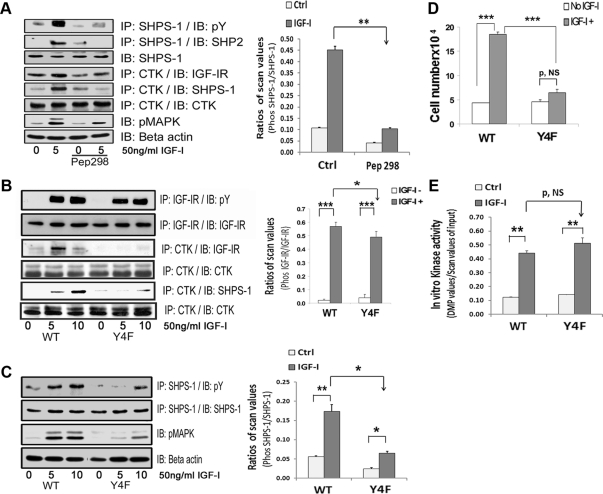
Fig. 6.
CTK transfer to IGF-IR facilitates SHPS-1 phosphorylation. A, VSMC maintained in DMEM-HG were serum starved and then incubated with or without cell-permeable peptide 298 at a concentration of 10 μg/ml for 2 h. IGF-I was added for 5 min with and without the peptide. Cell lysates were immunoprecipitated (IP) with an anti-CTK antibody and immunoblotted (IB) with anti-IGF-IR (fourth panel), anti-SHPS1 (fifth panel), or anti-CTK antibodies (sixth panel). The cell lysates were also immunoprecipitated with anti-SHPS-1 antibody and immunoblotted for pY (first panel) or SHP-2 (second panel). Twenty micrograms of protein from the same or similar cell lysates were directly immunoblotted with anti-SHPS-1 (third panel), pMAPK (seventh panel) or anti-β-actin (eighth panel) antibodies. The bar graph shows the relative decrease in SHPS-1 phosphorylation for at least three independent experiments. The error bars represent mean ± se. **, P < 0.001 when the increase in SHPS-1 phosphorylation in response to IGF-I is compared with or without peptide 298 (Pep298). Ctrl, Control. B, Confluent VSMC expressing IGF-IR-WT and IGF-IR-Y4F mutant cells were serum starved for 16 h in DMEM-HG and then exposed to IGF-I for 5 or 10 min. Cell lysates were immunoprecipitated with an anti-IGF-IR antibody and immunoblotted for pY (first panel) or for total IGF-IR (second panel). Cell lysates from the same experiments were immunoprecipitated with an anti-CTK antibody and immunoblotted using an anti-IGF-IR antibody (third panel), an anti-SHPS1 antibody (fifth panel), or an anti-CTK antibody (fourth and sixth panels). C, Lysates from an experiment similar to that shown in B were immunoprecipitated with an anti-SHPS-1 antibody and immunoblotted for pY (first panel) or total SHPS-1 (second panel). Twenty micrograms of total protein from the above cell lysates were directly immunoblotted with anti-pMAPK (third panel) or anti-β-actin (fourth panel). The bar graph represents the pooled results from three independent experiments and shows the relative decrease in SHPS-1 phosphorylation. The error bars represent mean ± se. **, P < 0.01; * P < 0.05 indicate the significant differences between two treatments or two cell types. D, IGF-I-R-WT and IGF-I-R-Y4F cells were plated (3 × 10⁴) in DMEM-HG with 2% FBS before exposure to IGF-I (50 ng/ml) in DMEM-HG with 0.2% platelet-poor plasma. Forty-eight hours after the addition of IGF-I, cell number was determined by tryptan blue staining and counting. The bar graphs show pooled results from at least three independent experiments. Error bars represent mean ± se. ***, P < 0.001 when number of proliferating cells is compared between WT and Y4F cells in response to IGF-I. P, NS indicates no significant difference between two treatments. E, Confluent VSMC expressing IGF-IR-WT and IGF-IR-Y4F mutant cells were serum starved for 16 h in DMEM-HG and then exposed to IGF-I for 1 min. As indicated, cell lysates were precleared with protein A beads and then immunoprecipitated with an anti-IGF-IR antibody. Immunoprecipitates were used in an in vitro kinase reaction as described in Materials and Methods. The relative kinase activity is depicted in the bar graph. The error bars represent mean ± se. P = NS. **, P < 0.01 indicates a significant difference between two treatments. P, NS indicates no significant difference.

