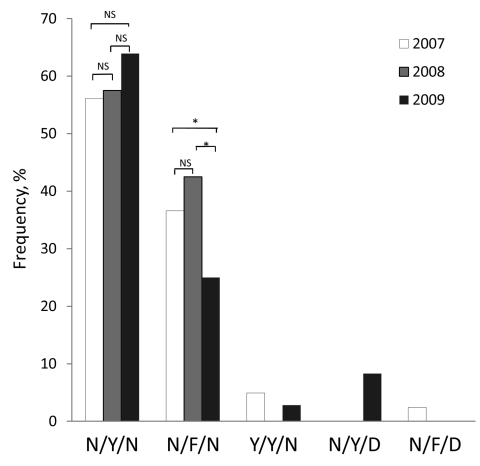
Figure 2.
Annual prevalence of Plasmodium falciparum dihydrofolate reductase haplotypes among clinical samples collected from Kachin State, northeast Myanmar, 2007–2009. The x-axis shows the 5 haplotypes (the amino acids at positions 86, 184, and 1042 with mutated amino acids in boldface). The χ2 test was performed to compare prevalence of 2 major haplotypes between years. For each haplotype, NS denotes no significant difference (p>0.05) between years; asterisk (*) denotes significant difference (p<0.05) between years.

