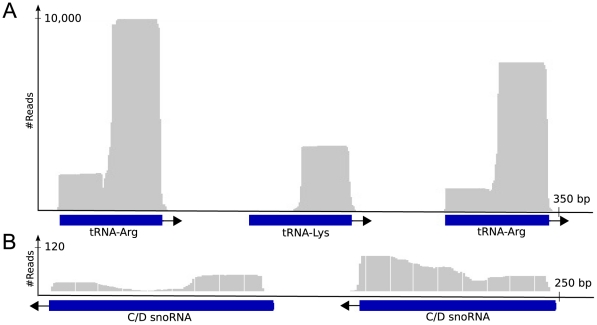
Figure 2. Schematic illustration of small RNA alignments to tRNA and snoRNA genes.
Schematic illustration of small RNAs aligned to known non-coding RNA genes (three tRNA genes and two snoRNA genes). The top graphs display the read density along the genes. Blue bars represent genes and arrows indicate the direction of genes (forward or reverse strand). A) Shows three tRNA genes (Tc00.1047053509105.114, Tc00.1047053509105.116, Tc00.1047053509105.118). The 3′ part of the tRNA gene display higher read depth than the 5′ part. B) Shows two C/D small nucleolar genes (Tc00.1047053508461.74, Tc00.1047053508461.75).

