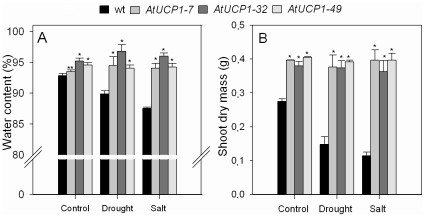
Figure 3. Water content (A) and shoot dry mass (B) in stressed leaves of wild-type (WT) and AtUCP1 transgenic plants (7, 32 and 49).
Thirty-day-old plants were exposed for 10 days to 200 mM mannitol or 175 mM NaCl and then recovered with pure water for 3 days. In the controls, plants were irrigated with water. The bar represents the mean, and I represents the standard deviation from three independent experiments (n = 5). * and ** indicate significant differences relative to the control at P<0.0001 and P<0.001, respectively.

