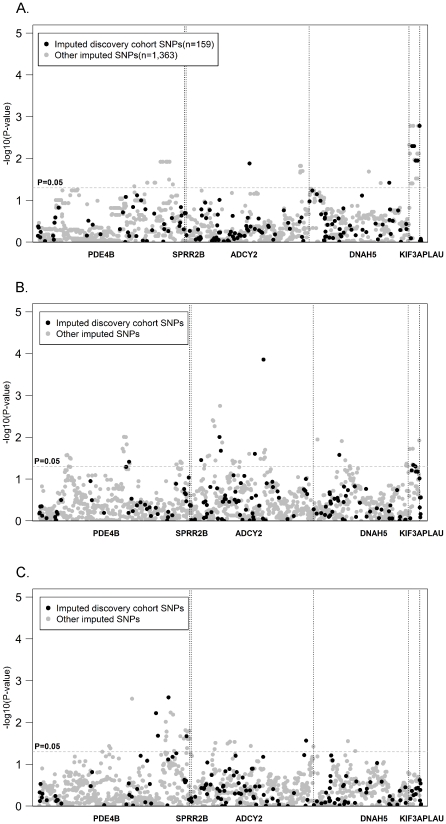
Figure 3. Associations with asthma in three additional independent populations.
SNPs not genotyped in the study were imputed based on HapMap CEU results (release 22) with MACH software using the available from the Affymetrix 6.0 genotype data. Imputed SNPs were then tested for associations with asthma using PLINK. The dashed line corresponds to a p-value of 0.05. A. Associations in a second Cincinnati-based Caucasian population. B. Asthma associations in the GALA Puerto Rican trios. C. Associations in the GALA Mexican trios.

