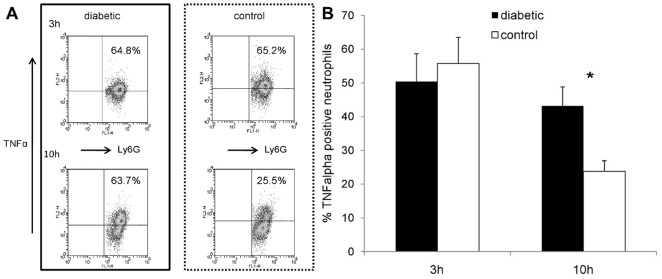
Figure 6. TNFα production by neutrophils isolated from the peritoneal cavities of mice 18 h after IP challenge with 108 CFU S. aureus PS80.
(A) Intracellular TNFα staining of neutrophils from a representative age-matched mouse pair 3 h (upper panels) or 10 h (lower panels) after neutrophil isolation. The upper right panels show the percentage of neutrophils that stained positive for TNFα production. (B) Whereas no significant differences were found between diabetic and nondiabetic mice after 3 h, diabetic animals had significantly more neutrophils positive for TNFα 10 h after neutrophil isolation. Data represent means ± SEM of data from six independent experiments. P values are calculated from pair-wise comparisons of age-matched mice; * indicates P<0.05.

