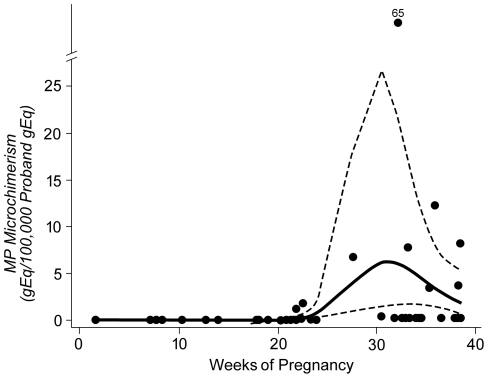
Figure 3. Curves indicate spline function showing model of expected concentration of MP microchimerism gEq in a stochastic sample of 100,000 proband gEq, according to gestational age.
Solid line indicates the point estimate of expected microchimerism concentration, and dashed lines indicate the 95% confidence interval. Scatterplot shows MP microchimerism concentration in proband PBMC by trimester (in gEq per 100,000 proband gEq).

