
Figure 2.

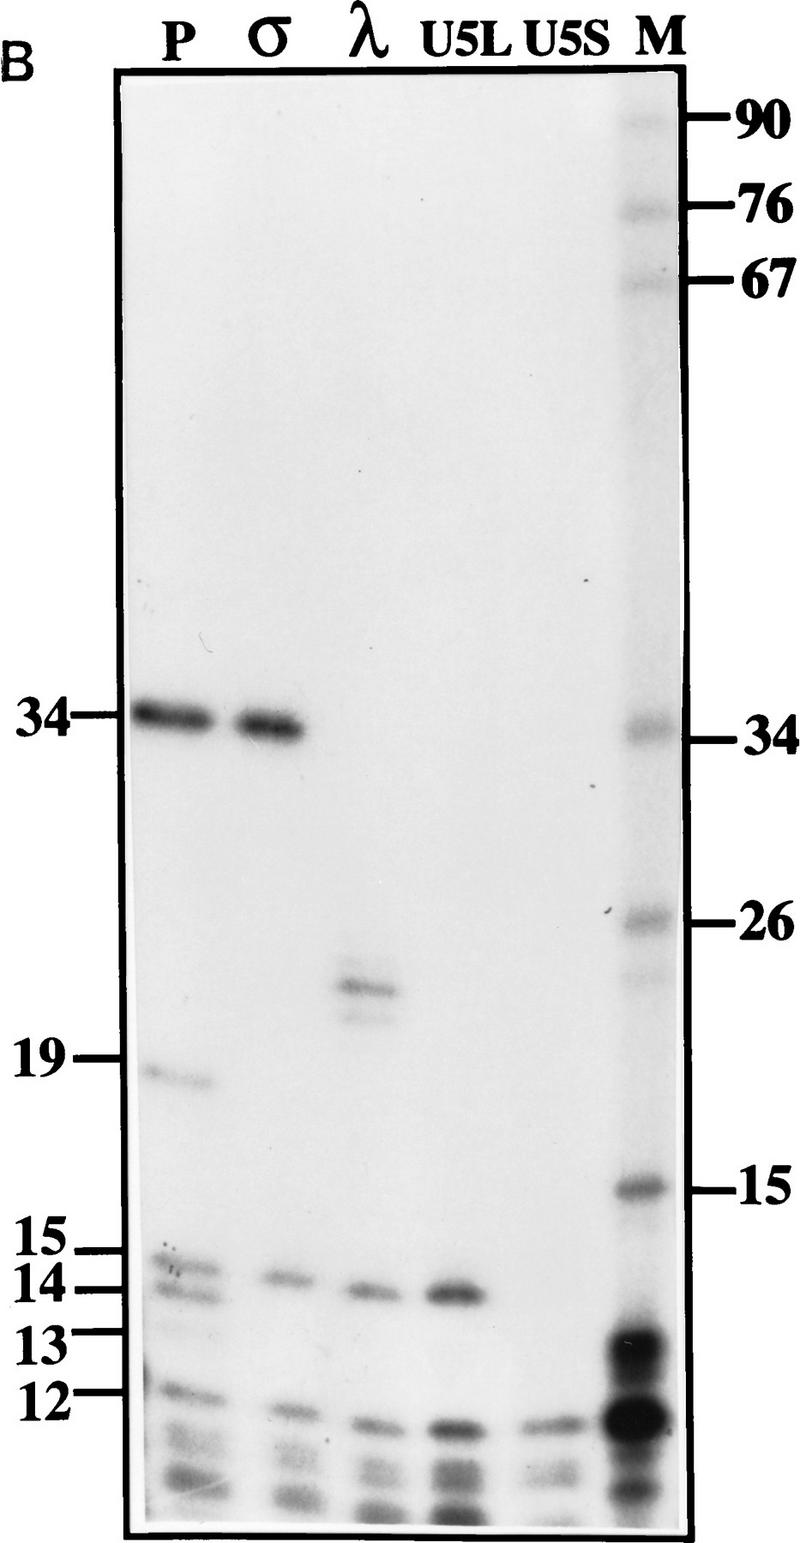

Mapping of 3′ ends of transcripts produced by in vitro processing. (A) Structure of the 3′ downstream genomic sequence. Shown are the diagnostic RNase T1 fragments, as well as the 3′ ends of putative intermediates, and products, deduced from the experiments shown in B and C and in Figs. 3B and 5C. Arrows from U5L and U5S indicate 3′ ends of the products of the in vitro reaction, whereas U5Long and U5Short indicate the 3′ ends of the long and short forms of U5 mapped in vivo. No diagnostic T1 fragment is found in the remaining part of the precursor; therefore, this part of the molecule is not shown. (B) RNase T1 mapping. Shown is an autoradiograph of a 10% acrylamide gel. Each of the species (precursor, intermediates and products) was subjected to total digestion by RNase T1 (see Materials and Methods). Legends and marker as in Fig. 1B. Marker is shown as an indication of molecular weight but is composed of double-stranded DNA, whereas the mapped species are single-stranded RNA. Therefore, direct comparison of the sizes of low molecular weight fragments is not possible. (C) Mapping cleavage sites to the U5 flanking sequence. A 5′-labeled precursor was incubated for 2 min (lanes 1,2) or 45 min (lane 3) to give rise to intermediates and products and was loaded on a 5% acrylamide sequencing gel, in parallel with a sequence generated from the same precursor (see Materials and Methods), substituted with purine phosphorothioates (R) or uridine (U), and cleaved with iodine. Lanes 1 and 2 are loadings of different amounts of the same reaction.