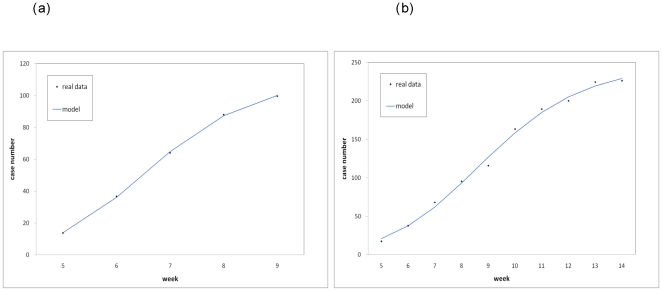
Figure 3. Model fit of the cumulative excess influenza case number in 2009 over the average weekly influenza case number of 2004-2008 in (a) Mexico City, weeks 5–9, 2009 (a) all of Mexico, weeks 5–14, 2009.
Dots are the real data and the curves denote the theoretical case numbers estimated by the Richards model.

