Figure 1.
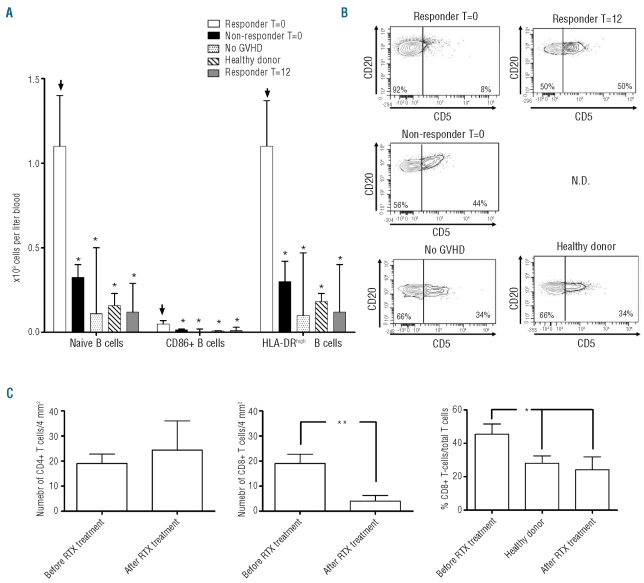
Possible predictive markers for responsiveness to RTX treatment and immunological changes after RTX treatment. (A) Absolute numbers of naïve (CD27−), and activated (HLA-DRhigh) B cells in responding, non-responding patients, No-GVHD and healthy donor controls. Arrows indicate the control group on which statistical analysis was performed by a Mann-Whitney-U test (*P<0.05). (B) Representative dot plots of cell surface expression of CD5 and CD20 in responding patients at T=0 and T=12, non-responding patients at T=0, No-GVHD and healthy-donor controls. Number of skin-infiltrating (C) CD4+ and CD8+ T cells before and five months after RTX treatment in responding patients as well as percentage of skin-infiltrating CD8+ T cells before and after RTX treatment in responders and healthy controls. Statistical analysis was performed using an unpaired t-test and a two-way ANOVA (*P<0.05, **P<0.01).

