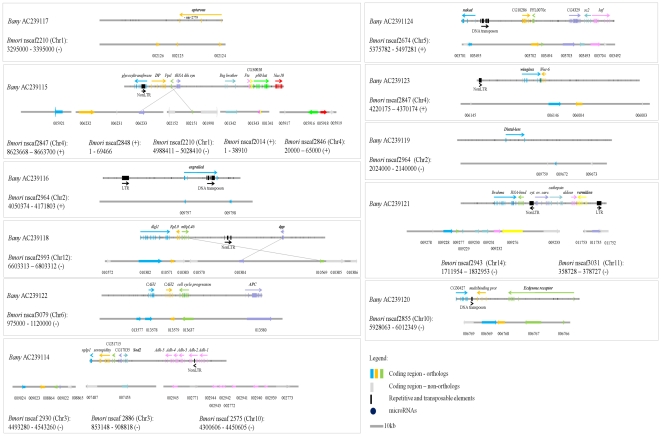
Figure 1. Annotation of B. anynana genomic regions and fine-scale synteny with B. mori.
Each B. anynana BAC sequence is represented, with the corresponding scaffold in B. mori (including information on chromosomal location). Each putative gene is represented by a different color: B. anynana gene names in bold correspond to those on which BAC selection was based (Table 1), and B. mori gene names reflect SilkDB annotation (e.g., 010572 is SilkDB gene BGIBMGA010572). Exons are explicitly annotated for B. anynana as stripes of the same color (darker shade for duplicated exons). Arrows indicate the direction of transcription of each gene, and fine lines are used for highlighting chromosomal rearrangements. The figure contains a legend for the representation of sequence length, and for the protein-coding genes, repetitive sequence, transposable elements, and microRNA identified in this study. Details on all B. anynana predicted peptides can be found in Table S3.

