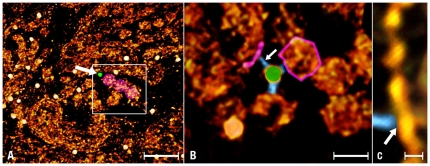
Figure 5. Tethers.
Panel A is a low magnification view of a fiber cell labeled with anti-αA-crystalline/gold complexes (white discs). At this magnification, the larger conjugates (∼7 nm diameter) appear randomly scattered in the volume and the tethers that connect them to protein assemblies are not visible. To identify these tethers, small volumes (square, 128 128 47 pixels) around a central gold conjugate were cut and segmented using the watershed transform (see Methods). Panel B is a view of the square in A. It was rotated to find out the direction that visualized these tethers. Three tethers (blue) connected the gold conjugate (green) to protein assemblies shaped as thin filaments and spherical particles (red). Panel C is a higher magnification view of the thin filament colored red in B. The arrow indicates place where the tether (blue) joins the thin filament. Bar: A = 70 nm; B = 12 nm; C = 5 nm.

