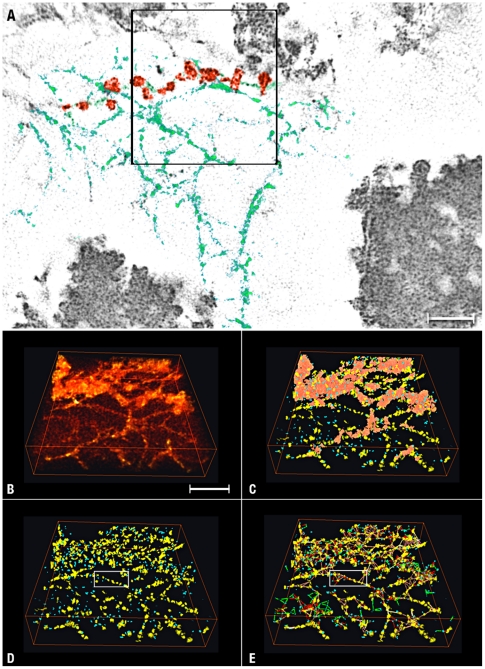
Figure 7. Analysis of Unlabeled Cells.
Panel A is a single-pixel slice showing matrices comprised of filaments (green) and ∼15 nm diameter particles, referred as “bead” assemblies (red). The region inside the square (256 256 47 pixels) was segmented to reveal the repeating particles that decorate the filaments and comprise the “beads.” Bars A = 45 nm. Panels B–E show selected steps of the analysis. Panel B shows the volume in the square before segmentation. Panel C shows small (blue) and large (yellow) protein particles generated by segmentation. The irregular regions colored brown represent “aggregates comprised of particles >7 nm diameter. Panel D shows the same volume after removing the “aggregates.” Panel E shows the map after measuring the Euclidian distances between blue and yellow protein particles. Lines color-coded according to the dimensions of the particles connected the centers of mass of blue-to-blue, yellow-to-blue and yellow-to-yellow particles (see Table 2). Bar: 60 nm.

