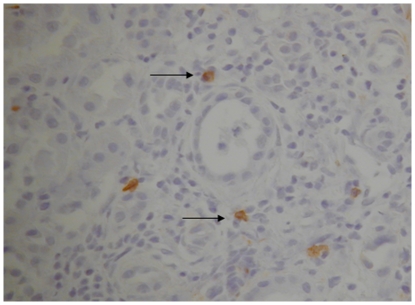
Figure 4. Immunohistochemistry slide demonstrating donor derived CD56 positive cells (anti-CD56 antibody staining brown in colour: arrow as indicator) in pre-transplant kidney biopsy tissue.
In brief, the method for development of this slide included dewaxing and antigen retrieval obtained by W-cap system (Bio-Optica) and staining with mouse monoclonal anti-CD56 antibody (IgG2b Novocastra) used at a dilution of 1∶50 and visualised with the EnVision detection system (DAKO). This image is representative of the observation made for biopsies taken from five different kidney transplants studied. Cell counts (degree of infiltration) were performed using light microscopy and counting 10 randomly selected high power fields at a magnification of 400× (area = 0.17 mm2). Mean (±SEM) of 3±2 CD56 positive cells were identified per high power field.

