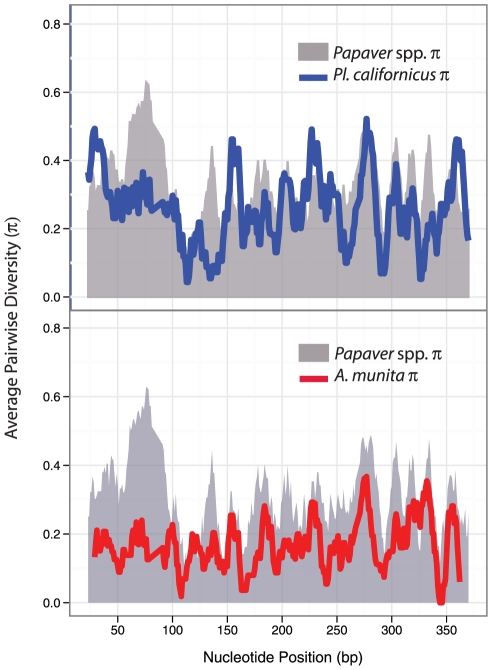
Figure 4. Sliding window analysis of average pairwise nucleotide diversity (π) of putative S-alleles.
Data consist of 10 Papaver spp (gray), 11 P. californicus (blue), and 11 A. munita (red) sequences possessing 5′ ends. Regions of high divergence across the three genera appear in similar positions. Divergence was estimated using DNASP [72].

