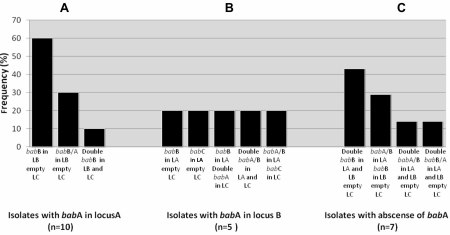
Figure 2.
Frequency of bab genes profiles at the three common chromosomal sites in patients without inter- or intra-micro-niche variations. A. Isolates with babA in locus A. B. Isolates with babA in locus B. C. Isolates with absence of babA. Locus A: downstream of hypD gene, Locus B downstream s18 gene, Locus C: downstream the conserved hypothetical protein gene, hp0318 in H. pylori 26695. LA: Locus A, LB: Locus B, LC: Locus C.

