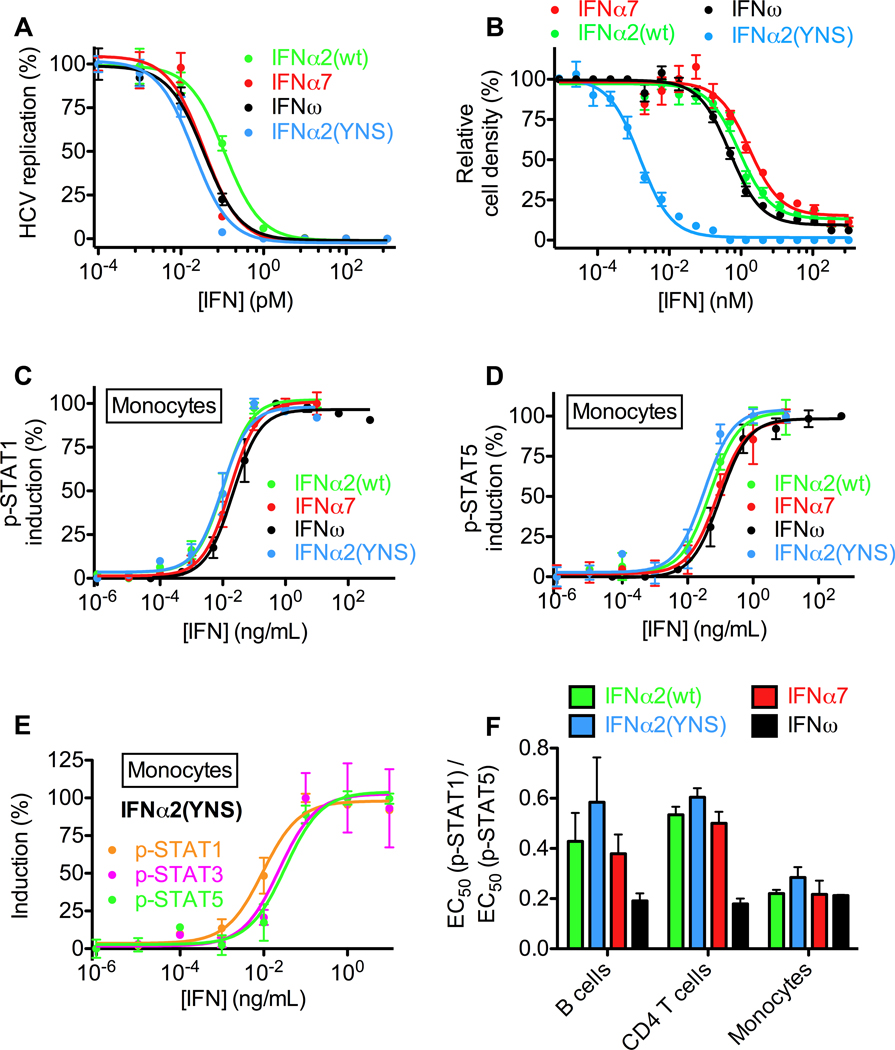
Figure 1. Differential activities and potencies of type I IFNs.
(A) Antiviral dose-response curves of human hepatoma (Huh7.5) cells transfected with genomic hepatitis C virus (HCV) RNA and treated with IFNα2(wt), IFNα2(YNS), IFNω or IFNα7. (B) Antiproliferative dose-response curves of human amniotic epithelial (WISH) cells treated with IFNα2(wt), IFNα2(YNS), IFNω or IFNα7. (C) Dose-response curves for STAT1 phosphorylation in monocytes from human whole blood, as determined by Phospho-Flow analysis. (D) Dose-response curves for STAT5 phosphorylation in monocytes from human whole blood, as determined by Phospho-Flow cytometry analysis. (E) IFNα2(YNS) more potently induces pSTAT1 than pSTAT3 or pSTAT5 in human primary monocytes. (F) Differential signaling properties of IFNα2(wt), IFNα2(YNS), IFNω and IFNα7 as evidenced by different ratios of pSTAT1 to pSTAT5 EC50 values in different cell types from human whole blood. See also Figure S1.

