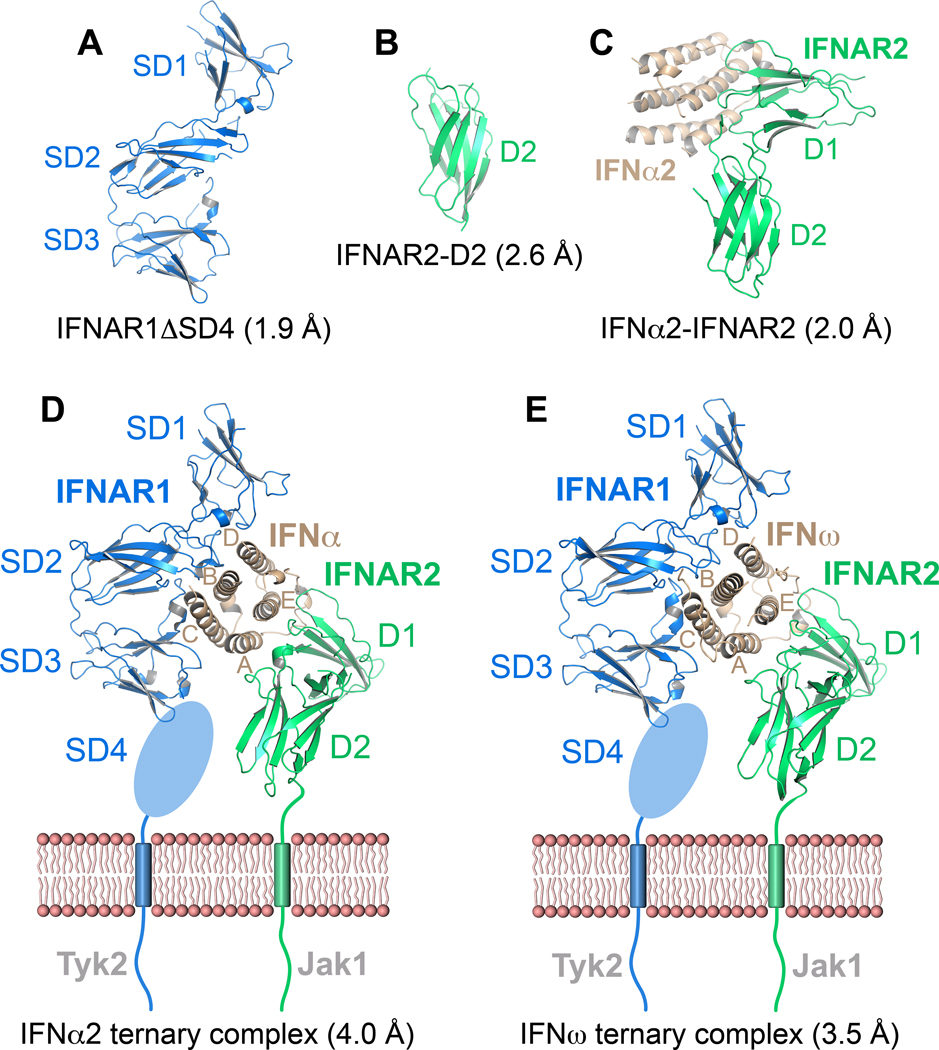
Figure 2. Crystal structures of type I IFN receptor components and ligand-receptor complexes.
Ribbon representations and designated resolutions of (A) IFNAR1ΔSD4. (B) IFNAR2-D2. (C) The IFNα2(HEQ)-IFNAR2 binary complex (IFNα2(HEQ) brown, IFNAR2 green). (D) Ternary complex of IFNAR1 (blue), IFNAR2 (green) and IFNα2(YNS). (E) Ternary complex of IFNAR1 (blue), IFNAR2 (green) and IFNω. The membrane-proximal SD4 domain of IFNAR1 is depicted as an oval. See also Table S1 and Figure S2.

