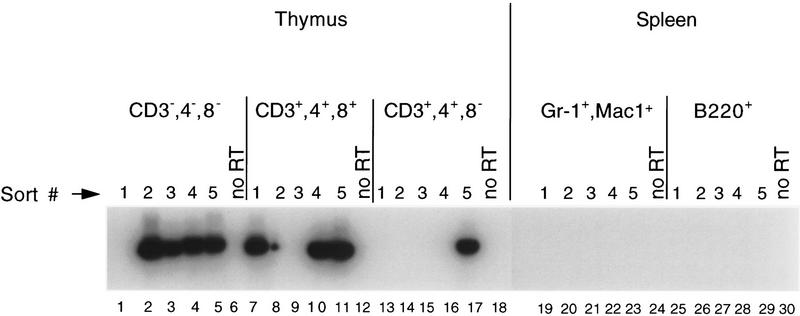
Figure 7.
Helios expression in thymocyte and splenic cell subsets. Twenty cells of the indicated cell-surface phenotypes were sorted by FACS for analysis of Helios expression during thymocyte maturation and in non-T-lineage cell subsets. Primers for nested PCR amplified across sequences that encode the four amino-terminal zinc fingers of Helios. The PCR products observed with the various samples exhibit slightly different migrations, which represent the amplification of both the Helios A and Helios B products with predicted sizes of 712 and 790 bp, respectively.

