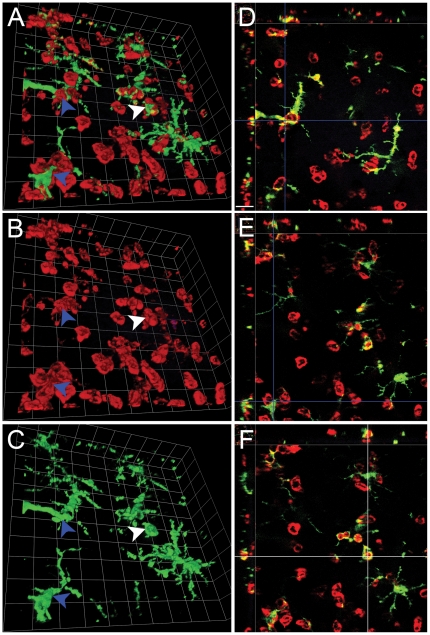
Figure 5. Stereotactic injection of Tat results in reciprocal engulfment of microglia and infiltrating leukocytes.
Montage of higher magnification micrographs with 3D reconstruction of GFP+ microglia (green) interacting with infiltrating CD11b+ leukocytes (red) in the right hippocampus of mice injected with Tat 24 hours earlier (Panels A, B, and C) and XYZ views at different depths of the same image stack (Panels D, E, and F). Blue arrowheads points to the corresponding locations where infiltrating leukocytes engulf microglia processes. Panel A shows a combined view of CD11b (red) and GFP (green) expression, while panel B shows CD11b expression alone and panel C shows GFP expression alone. The white arrowhead points to the location where GFP+ microglial processes phagocytose a CD11b+ infiltrating leukocyte. To further illustrate the phagocytic nature of these cell-to-cell interactions, Panels D and E show the corresponding XYZ view of the location (the crossing point of the two blue cursor lines) of the top and bottom blue arrowhead in panel A, respectively. Panel F shows the XYZ view of the location (the crossing point of the two white cursor lines) of the white arrowhead in Panel A. Each side of individual grids = 14 µm for Panels A–C, and the scale bar shown in Panel D = 16 µm for D–F. n = 3 independent replicates for Tat treatment.

