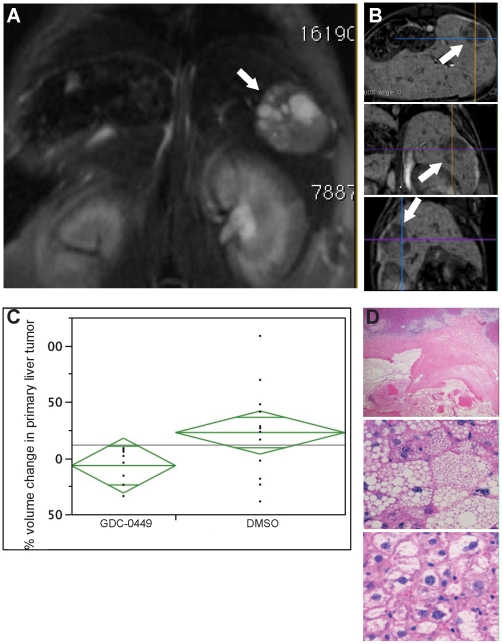
Figure 6. Hh pathway inhibition decreases in liver tumor volume by magnetic resonance imaging (MRI) and induces histologic features of tumor involution.
A. Representative cross-sectional image of intrahepatic tumor as identified by contrast-enhanced MRI following GDC-0449 treatment. B. Representative MRI images of sagittal, coronal, and oblique perspectives used for volumetric analysis. C. Change in tumor volume were quantified by computerize generated volumetric measurements and graphed as Mean±SD (*p<0.05). D. Micrographs of representative histologic changes induced by, GDC-0449, treatment. Top panel shows tumor necrosis; middle panel demonstrates fatty degeneration; bottom panel show vacuolated tumor cells with pyknotic nuclei.

