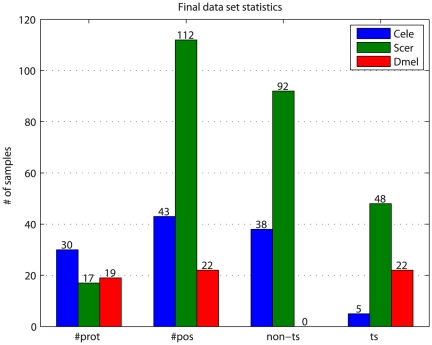
Figure 4. Training set statistics.
Counts are shown for the total number of proteins (#prot), positions (#pos), and non-ts and ts samples, separated by species. The training set comprises a total of 205 mutations (75 ts, 130 non-ts) to 177 sites in 66 proteins. Yeast has the largest number of samples, and the most balanced distribution of ts and non-ts samples; worm has only 5 ts samples, and fly lacks non-ts samples. The difference between the number of proteins and the number of positions for yeast is due to the presence of the histone complex data, which comprise many mutations to different positions within the same structure.

