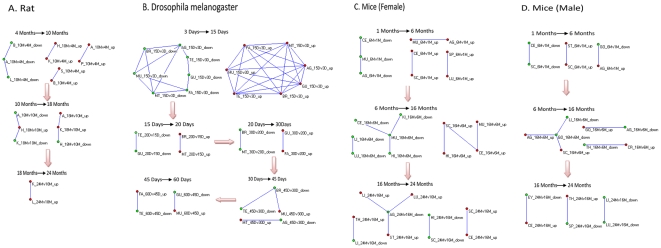
Figure 1. Temporal evolution of spatial association of gene expression during natural aging.
The dynamic tissues association network of gene expression with age were illustrated respectively for (A) rat, p<0.001; (B) Drosophila melanogaster, p<0.005; (C) female mice, p<0.005; and (D) male mice, p<0.005. Red, gene set with increased expression at a certain age phase in a tissue; green, decreased expression. Node names incorporate tissue name,age phase, and expression direction. For example, the red node named A_10Mv4M_up (A) denotes an upregulated gene set from 4 to 10 months in adrenal gland (A). The connection between red (or green) nodes illustrates a significant number of genes synchronously increased (or decreased) in expression in the two connected tissues; red and green describe asynchronous behavior. For nodes not connected into networks, genes in the tissue lacked significant association with the others, reflecting a stochastic space relationship.

