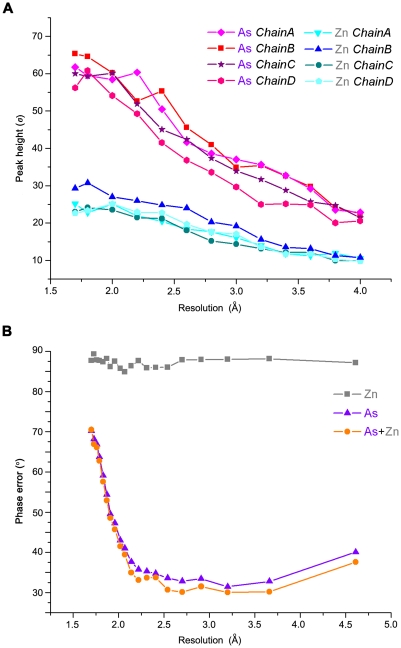
Figure 4. Anomalous differences between arsenic and zinc.
A. The anomalous signal reduction as a function of resolution. The peak heights of the heavy atoms were derived from the anomalous Fourier map, which was calculated using final phases. B. SAD phase errors (after density modification) against the final model as a function of resolution cutoff. Different colors represent the phases calculated from different anomalous scatterers: phases calculated from zinc atoms are shown in silver, those from arsenic atoms are shown in purple and from both are shown in orange.

