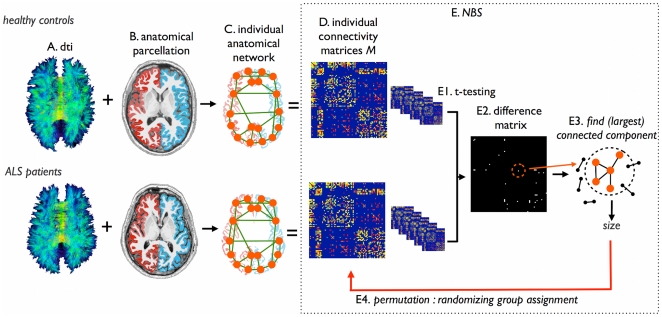
Figure 1. Overview of the network selection procedure and the Network Based Statistics (NBS).
(a) Using the DTI data, white matter tracts of the brain were reconstructed. (b) Cortical and sub-cortical brain regions were selected by automatic parcellation of the cerebrum. (c) An individual brain network was defined, consisting of nodes (i.e. the parcellated brain regions) and connections between nodes i and j that were connected by a white matter pathway. (d) Repeating this for each region i and j in the collection of parcellated brain regions, resulted in a (weighted) connectivity matrix M. Connections were weighted by their FA value, as determined from the DTI measurement. Next, using Network Based Statistics (NBS), the connectivity matrices of ALS patients and controls were compared. (e1) First, each connection between region i and j was tested between patients and controls using t-statistics. (e2) This resulted in a binary difference matrix, with 1s for those connections that showed a (absolute) t-value between controls and patients higher than a set T-threshold T, and 0 otherwise. Third, the sizes of the (largest) connected components in the difference matrix was computed, revealing sub-networks of regions showing affected connectivity in patients. Fourth, permutation testing was used to define a distribution of (largest) component size that could occur under the null-hypothesis (i.e. no difference between patient and controls). 5000 permutations, permuting group assignment, were computed. Finally, the original observed component size (i.e. difference between patients and controls) was given a p-value based on the computed null-distribution, by defining the percentage of the null-distribution that exceeded the size of the observed impaired network in patients.

