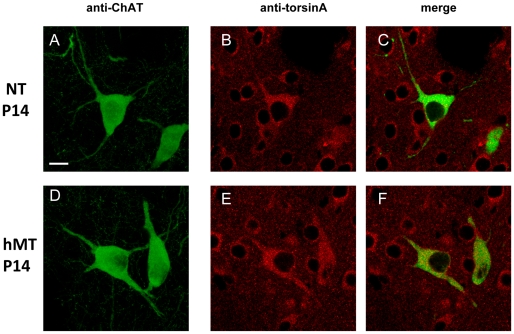
Figure 1. Immunohistochemical localization of torsinA in the cholinergic interneurons of NT and hMT mouse striatum.
Representative confocal images (z-series projections) obtained from coronal slices of NT and hMT mice immunolabelled for ChAT (green, A, D). The macroscopic morphology of ChAT-positive cholinergic interneurons is apparently the same in the two groups at P14. Representative confocal images (single sections) showing the immunostaining of torsinA (red, B and E) in the ChAT-positive cholinergic neurons (merge, C and F) of NT (B–C) and hMT (E–F) mice. The cellular distribution of torsinA is similar between the groups. Scale bars: 10 µm.

