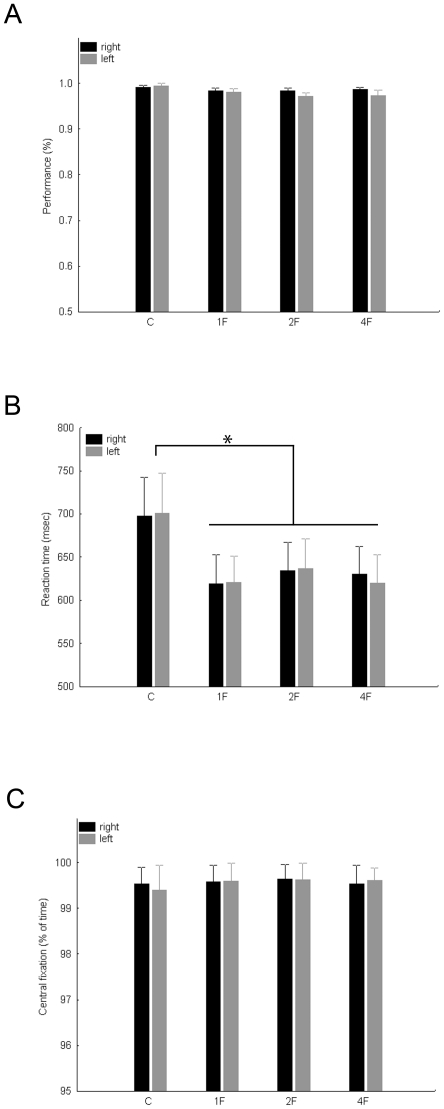
Figure 1. Subjects’ performance, reaction times and fixation performance in the behavioral control experiment separately for the Control (C), 1F, 2F (averaged across 2F0G, 2F1G and 2F2G conditions) and 4F conditions and for right (black) and left (gray) visual fields.
A. Average detection performance. B. Average reaction times of the celebrity detection task. C. Eye-fixation performance expressed as proportion of trial-time (see Methods for details). Error bars represent standard error of means.

