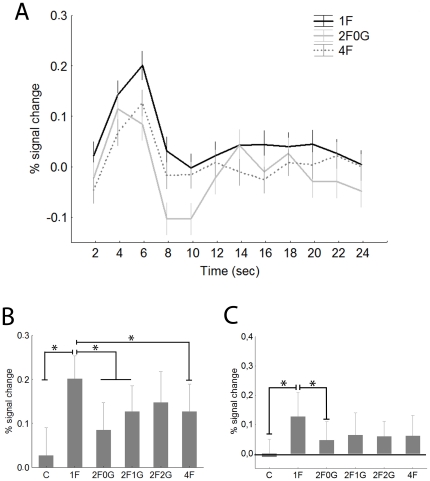
Figure 2. The right FFA.
A Time course (mean ±standard error) of fMRI activity for contralateral visual presentations. For sake of clarity only the 1F (black), 2F0G (gray) and 4F (dashed) conditions are depicted. Data derived from a finite impulse response (FIR) model with 2 s time bins. B. Average peak (4−6 sec) activation profiles (±standard error) of the right FFA for the six experimental conditions for contralateral stimulation. C. Average peak activation profiles (±standard error) of the right FFA for ipsilateral stimulation. C- control, noise images, 1F-single face, 2F0G- two neighbouring face images and two noise images, 2F1G- two faces with one noise image in between them, 2F2G- two faces, separated by two noise images, 4F- four face images. * - Fishers post-hoc comparisons: p<0.05.

