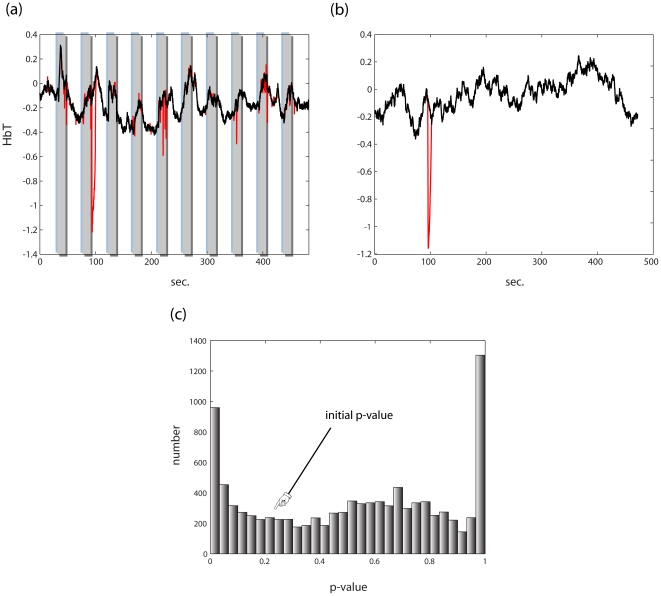
Figure 2. Reduction of motion artifact.
(a) In red, a NIRS time series contaminated by a motion artifact. Superimposed on it in black is the time series resulting from artifact cancellation. (b) In red, a simulated NIRS time series (phase randomized noise, exponent −2) to which a simulated motion artifact is added, matched to the one in (a) by amplitude and duration. In black is the time series resulting from artifact cancellation. (c) The time series in (b) was analyzed using the SPM hemodynamic response model and the feasible generalized least squares FGLS (feasible generalized least squares – i.e. whitening according to a power law fit + precoloring; 0.017 Hz) method described in Methods section 2.3, resulting in a p-value of 0.227. A set of 10000 artificial motion artifacts varying only in time of onset was generated and added to this time series and analyzed similarly. The resulting histogram of p-values demonstrates that motion artifact negation is imperative for valid statistical analysis. After motion artifact cancellation the correlation of these data to the original time series was 0.996±0.004, and the resulting p-value was 0.237±0.068 (reflecting the slight negative bias shown in 1(c)).

