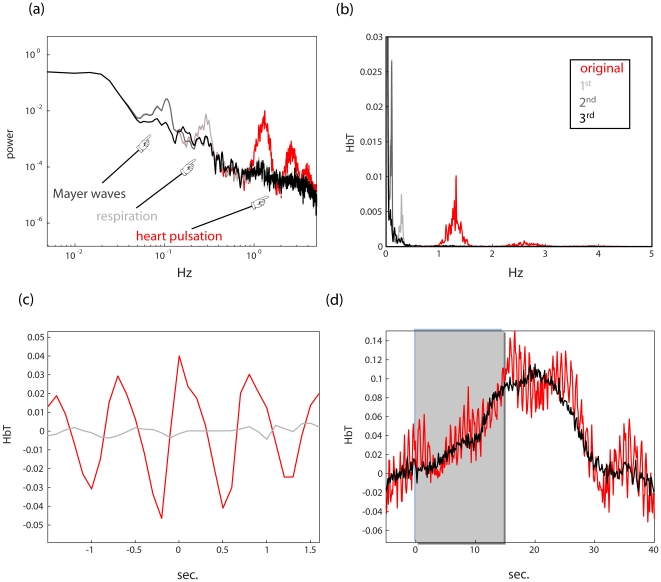
Figure 3. A recursive algorithm for systemic artifact reduction.
(a) A power spectrum of an activated NIRS channel (red) on a logarithmic scale. The spectrum exhibits excess energy in several frequency bands associated with periodic systemic artifacts: heart pulsations (1–2 Hz in adults), respiration (∼0.4 Hz in adults), and blood pressure (Mayer) waves (∼0.1 Hz). Superimposed on this are the spectra resulting from each successive application of the algorithm described in Methods section 2.1: in light gray after heart beat is removed (i.e. using [0.6 2] Hz), in dark gray after the second sweep, for respiratory artifacts (i.e. using [0.15 0.4] Hz), and finally in black after using [0.05 0.2] Hz for blood pressure waves. (b) The same plot in linear scale. (c) After the first sweep the NIRS time series was averaged around the detected heart beat onsets. As can be seen in gray, the artifact is all but gone as compared to averaging the original time series in the same fashion. (d) The above time series was averaged around stimulus onset (see Methods section 2.1 for details) before (red) and after (black) the procedure. As shown, the resulting response doesn't exhibit conspicuous oscillatory components.

