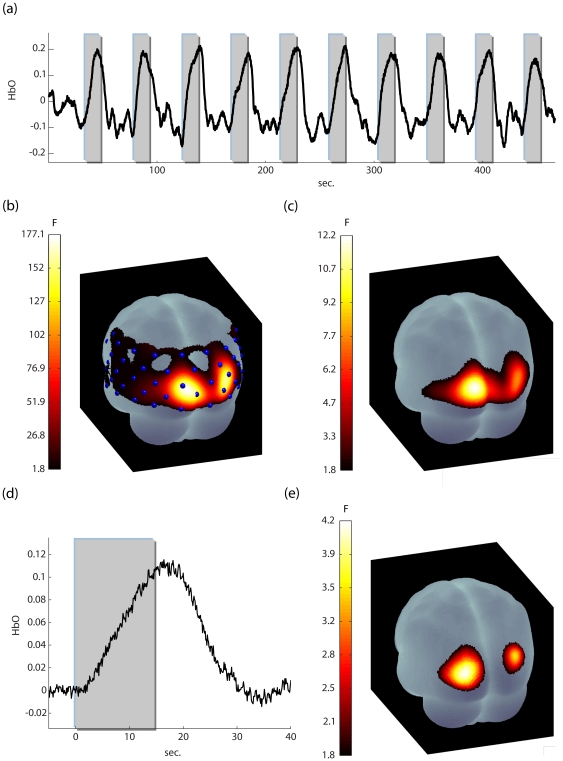
Figure 5. The results of the visual task.
(a) : a representative time series (Participant 8, channel 26). Data were band-passed filtered for purposes of presentation (b) the activation map (oxyhemoglobin data) for this participant, using a FIR model with precoloring (cutoff 0.017 Hz). 46 out of 52 channels are activated for p<0.01 (corrected for channel number). (c) the activation using a FIR model with whitening+precoloring (cutoff 0.017 Hz) for p<0.01 (corrected for channel number). Now activation is restricted to the visual areas. (d) the average activation for all participants (channel 26, n = 12). Note, that no residual oscillatory artifacts are present. (e) the activation map for all participants for the FIR model p<0.01 (corrected for channel number). Group analyses were carried out using the method described in Beckmann et al. ([20], see appendix S3).

