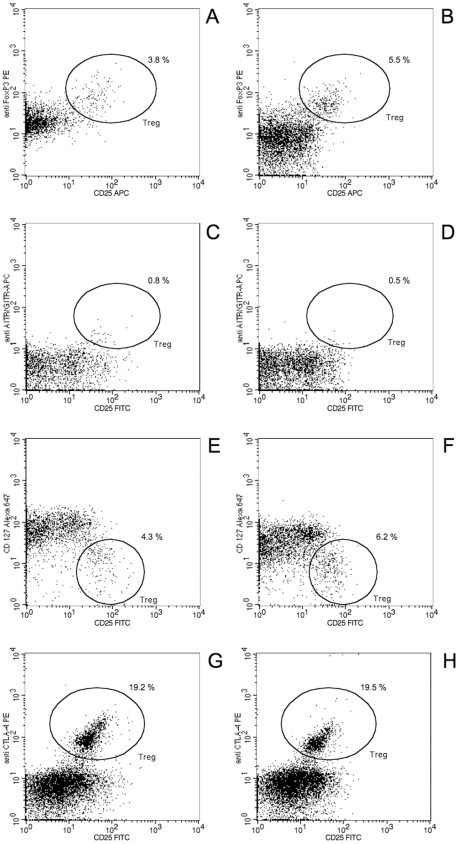
Figure 4. Flow cytometric analysis of Treg cells according to different markers.
Peripheral blood from one representative hearing-loss patient treated for 3 days (A, C, E, G) and 14 days (B, D, F, H) with glucocorticoid regimen was analyzed for the presence of regulatory T cells according to the following markers: CD4+ CD25high and FOXP3+ (A, B), AITR+ (C, D) CD127low (E, F) and CTLA4+ (G, H). Only CD4+ cells are depicted and the percentages indicate the relative frequency of Treg cells within this subpopulation.

