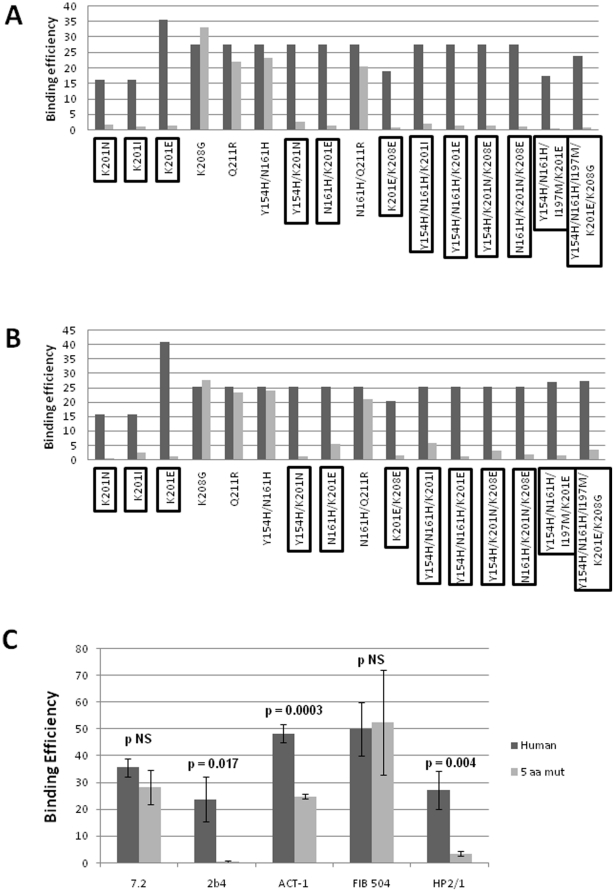
Figure 3. Binding efficiencies (BE) of different α4β7 molecules composed of distinct α4 mutants to monoclonal antibodies against α4, β7 or the α4β7 heterodimer.
Binding efficiency is determined by the ratio between the mean fluorescence of antibody binding to each α4 molecule and of the binding in a mock-transfected cell culture (see Materials and Methods for details). Dark gray bars represent binding to the human (wild type) α4 clone, whereas light gray bars are those of binding to the different α4 mutants (as shown in the x-axis). α4 mutants which included substitutions at codon 201 are boxed. A, binding of anti-α4 2b4 antibody. B, binding of anti-α4 HP2/1 antibody. C, BE of different anti-α4 and β7 antibodies to the human α4 and the quintuple α4 mutant (5 aa mut). Bars represent the range of standard errors deduced from triplicate experiments. p-values of Student's t tests are shown above each comparison. NS, non-significant (> 0.05).

