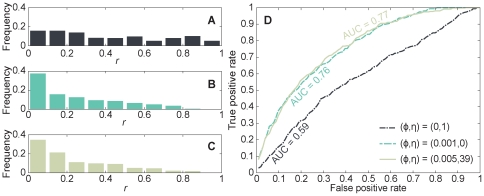
Figure 2. Parameter dependence of prediction performance.
(A) The distributions of r-ratios for the known OMIM disease genes of the 40 diseases under study, at (φ,η) = (0,1), i.e., only gene expression levels were used to predict disease genes. (B) The distributions of r-ratios for the known OMIM disease genes at (φ,η) = (0.001,0), i.e., only the PPI network was used in the ranking. (C) The distributions of r-ratios for the known OMIM disease genes at (φ,η) = (0.005,39), (C) ROC curves for (φ,η) = (0.005,39), (0.001,0), and (0,1), respectively.

