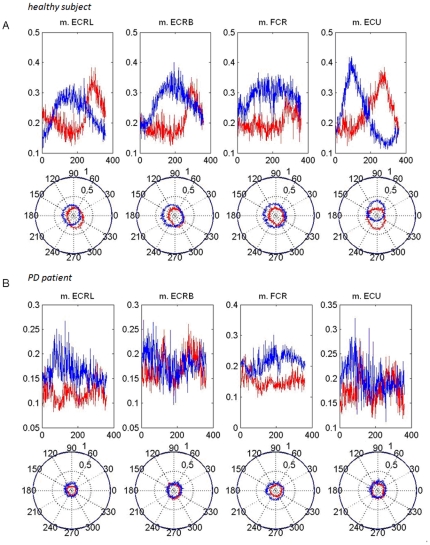
Figure 2. Examples of individual EMG data.
EMG (mean) data of one healthy subject (A) and one PD patient (B) showing electromyographic (EMG) data of four lower arm muscles (m. extensor carpi radialis longus, (m. ECRL), m. extensor carpi radialis brevis (m. ECRB), m. flexor carpi radialis (m. FCR) and m. extensor carpi ulnaris (m. ECU) as a function of angle along the circumduction trajectory. Top: linear plots of mean smoothed, rectified and scaled EMG (note differences in scale for both subjects). x-axis = position on the circle (in degrees), y-axis = EMG. Notice that the scaled EMG has been averaged over all cycles, so that maximum values smaller than 1 are attained. Bottom: polar plots of mean smoothed, rectified and scaled EMG; the latter data were used to quantify differentiated muscle use by fitting ellipses. blue plots: CW, red plots: CCW.

