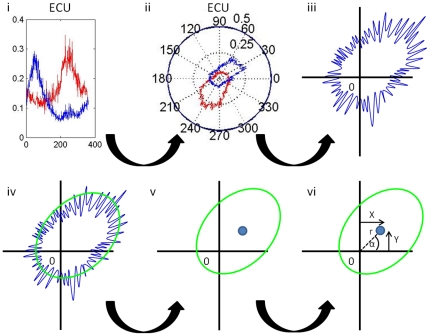
Figure 3. Quantification of muscle activity patterns.
i–iii: Example of individually filtered, rectified and scaled EMG data (m. extensor carpi ulnaris (m. ECU), blue = clockwise (CW), red = counter clockwise (CCW); the scaled EMG data is indicated along the 75 degree axis. iv–v: Scaled EMG power was fitted to an ellipse (resulting in ‘EMG ellipse’); vi: By transforming the coordinates (X,Y) of the center of the EMG ellipse to polar coordinates, the parameters differentiated muscle activity (DiffAct) and angle at maximum activity were obtained (Anglemax). DiffAct and Anglemax were used to compare differentiated muscle use between groups, muscles and direction.

