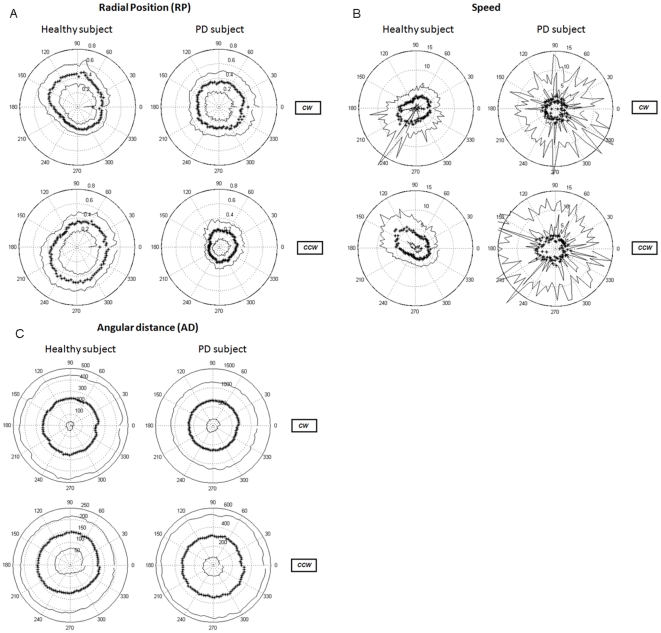
Figure 4. Examples of individual (mean) data in polar plots.
Left: healthy subject, right: PD patient. Top: clockwise (CW), bottom: counter clockwise (CCW). Star line: mean, solid lines: outer line: mean + SD, inner line: mean - SD. Angles are indicated in degrees along the outer circle. The scale for each individual plot is indicated along the 75 degree axis. A: radial position (RP, dimensionless), B: speed (rad/sec), C: angular distance (AD, in degrees). Note the differences in scale for the AD plots.

