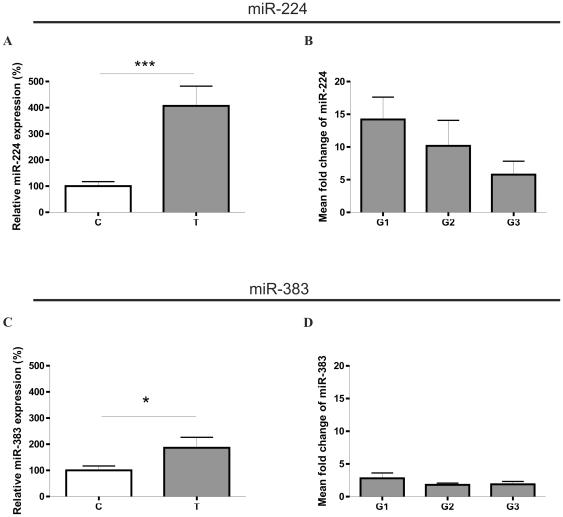
Figure 1. Expression of miR-224 (A and B) and miR-383 (C and D) in ccRCC.
A. Increased miR-224 expression in ccRCC tumor samples (T) compared with control samples (C). The expression is shown as percentage of control C. B. Mean fold T: C change of expression of miR-224 224 in samples divided according to tumor differentation grades (G1, G2, G3). C. Increased miR-383 expression in ccRCC tumor samples (T) compared to control samples (C). The expression is shown as percentage of control C. D. Mean fold T: C change of expression of miR-383 224 in samples divided according to tumor differentation grades (G1, G2, G3). Data are given as mean ± SEM n = 32 for T, n = 32 for C (in A and C), n = 11 for G1, n = 11 for G2, n = 10 for G3 (in B and D). Statistical analysis was performed using paired t-test to compare C and T samples (in A and C) or ANOVA to compare G1, G2, and G3 samples (in B and D)* p<0.05, *** p<0.001.

