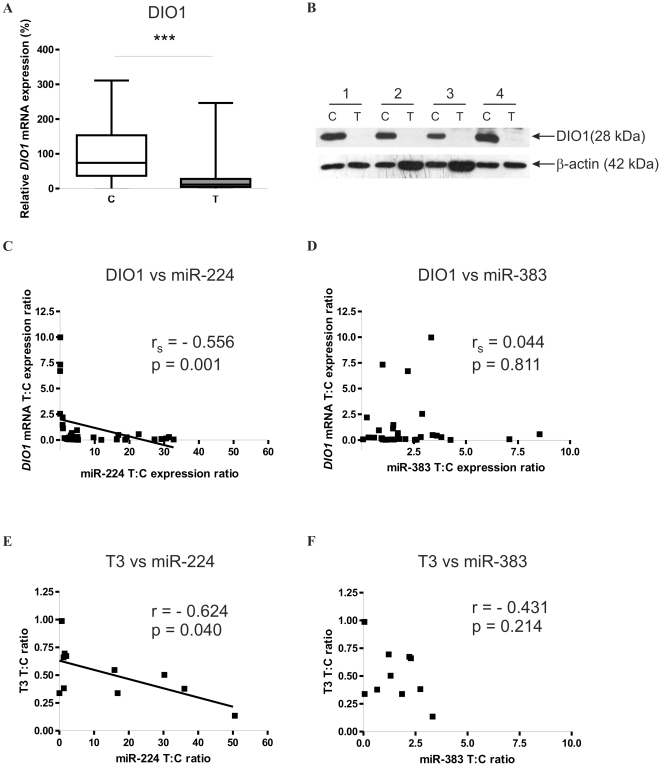
Figure 2. miR-224 expression negatively correlates with DIO1 mRNA and T3 in ccRCC.
A. Expression of DIO1 mRNA in tissue samples. n = 32 for T and n = 32 for C. The expression is shown as percentage of control C. The plot shows median values with 95% CI as data were not normally distributed. Statistical analysis was performed using Wilcoxon paired test to compare C and T samples. *** p<0.001. B. Western-blot of DIO1 performed on pair-matched control-ccRCC samples. β-actin expression was used as an internal control. Four representative control (C) and tumor (T) samples are shown. C and D. Scatter plots of the T: C ratios of DIO1 mRNA versus T: C miR-224 (C) and T: C miR-383 (D) expression ratios. Non-parametric Spearman's rank correlation analysis was performed on data from 32 pairs of control and tumor tissue samples. p<0.05 was considered statistically significant. E and F. Scatter plots of T3 concentration T: C ratio versus T: C miR-224 (E) and miR-383 (F) expression ratios. Pearson correlation analysis was performed on data from 11 pairs of control and tumor tissue samples. p<0.05 was considered statistically significant.

